My professional space, monitoring, is deceptive. How hard could it be, after all -- you just make sure stuff is up. Worst case, you figure out Nagios or Zabbix or something, and set that up.
Well, scalable enterprise-level monitoring is actually quite hard. Every internal team has a different idea of what monitoring is -- if you ask 10 people what monitoring is, you'll get 8 to 12 answers, with plenty of overlap and plenty of differences in opinion.
There are at least a dozen other decent open source monitoring tools, plus several dozen commercial (small and large) tools out there. I work in an open source shop, and a long career has taught me that getting funding for an expensive monitoring package is unlikely to happen. And when it does, then 3 or 4 years later, somebody will refuse to pay the maintenance fee. So open source it is for me. I'll just mention a couple in this post, a couple that we use heavily.
Nagios is not a bad first step -- at its core, it's just a time-based script executor with the ability to call alert scripts. -- conditional cron=simple It can tell you when stuff is down, when it's low on resources, when it's not responding. It has plugins for all sorts of things. But those plugins are clunky. The configuration is super clunky. Any time you need to change something, you have to restart Nagios. That's just plain icky. By default you get no historical data, no intelligent escalation, and by the time you've added plugins to help those out, your little Nagios instances has morphed into something quite different. And scaling that different thing is not pretty. Trust me -- I have 120 Nagios servers in my environment.
Zabbix gives you more functionality out of the box. I personally find the model awkward, but it gives you nice graphing, a decent UI (as opposed to Nagios config files and VI), a decent API, etc. But scale it out beyond a few thousand hosts and MySQL melts down. I have 50,000 hosts to monitor, with 350,000 services (by Nagios reckoning). And as soon as anybody sees graphs, they want 10 times as many metrics collected.
It's funny, but speaking of graphs, most people nowadays see graphs and dashboarding as central to monitoring. Not that these buy you alerts, but they are considered critical for troubleshooting and trend analysis. And, to be honest, they lend themselves nicely to proactive analysis, which can save you from downtime generating crashes.
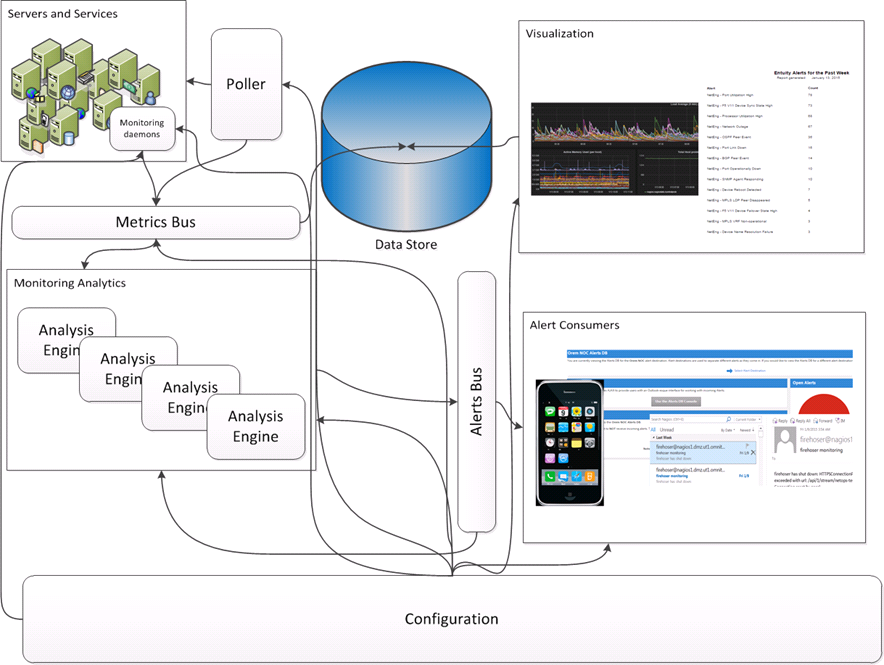
So, my team's solution? Something like this:
Well, scalable enterprise-level monitoring is actually quite hard. Every internal team has a different idea of what monitoring is -- if you ask 10 people what monitoring is, you'll get 8 to 12 answers, with plenty of overlap and plenty of differences in opinion.
There are at least a dozen other decent open source monitoring tools, plus several dozen commercial (small and large) tools out there. I work in an open source shop, and a long career has taught me that getting funding for an expensive monitoring package is unlikely to happen. And when it does, then 3 or 4 years later, somebody will refuse to pay the maintenance fee. So open source it is for me. I'll just mention a couple in this post, a couple that we use heavily.
Nagios is not a bad first step -- at its core, it's just a time-based script executor with the ability to call alert scripts. -- conditional cron=simple It can tell you when stuff is down, when it's low on resources, when it's not responding. It has plugins for all sorts of things. But those plugins are clunky. The configuration is super clunky. Any time you need to change something, you have to restart Nagios. That's just plain icky. By default you get no historical data, no intelligent escalation, and by the time you've added plugins to help those out, your little Nagios instances has morphed into something quite different. And scaling that different thing is not pretty. Trust me -- I have 120 Nagios servers in my environment.
Zabbix gives you more functionality out of the box. I personally find the model awkward, but it gives you nice graphing, a decent UI (as opposed to Nagios config files and VI), a decent API, etc. But scale it out beyond a few thousand hosts and MySQL melts down. I have 50,000 hosts to monitor, with 350,000 services (by Nagios reckoning). And as soon as anybody sees graphs, they want 10 times as many metrics collected.
It's funny, but speaking of graphs, most people nowadays see graphs and dashboarding as central to monitoring. Not that these buy you alerts, but they are considered critical for troubleshooting and trend analysis. And, to be honest, they lend themselves nicely to proactive analysis, which can save you from downtime generating crashes.
So, my team's solution? Something like this:

 RSS Feed
